Санкт-Петербург
Фильтр
 Видео
Видео
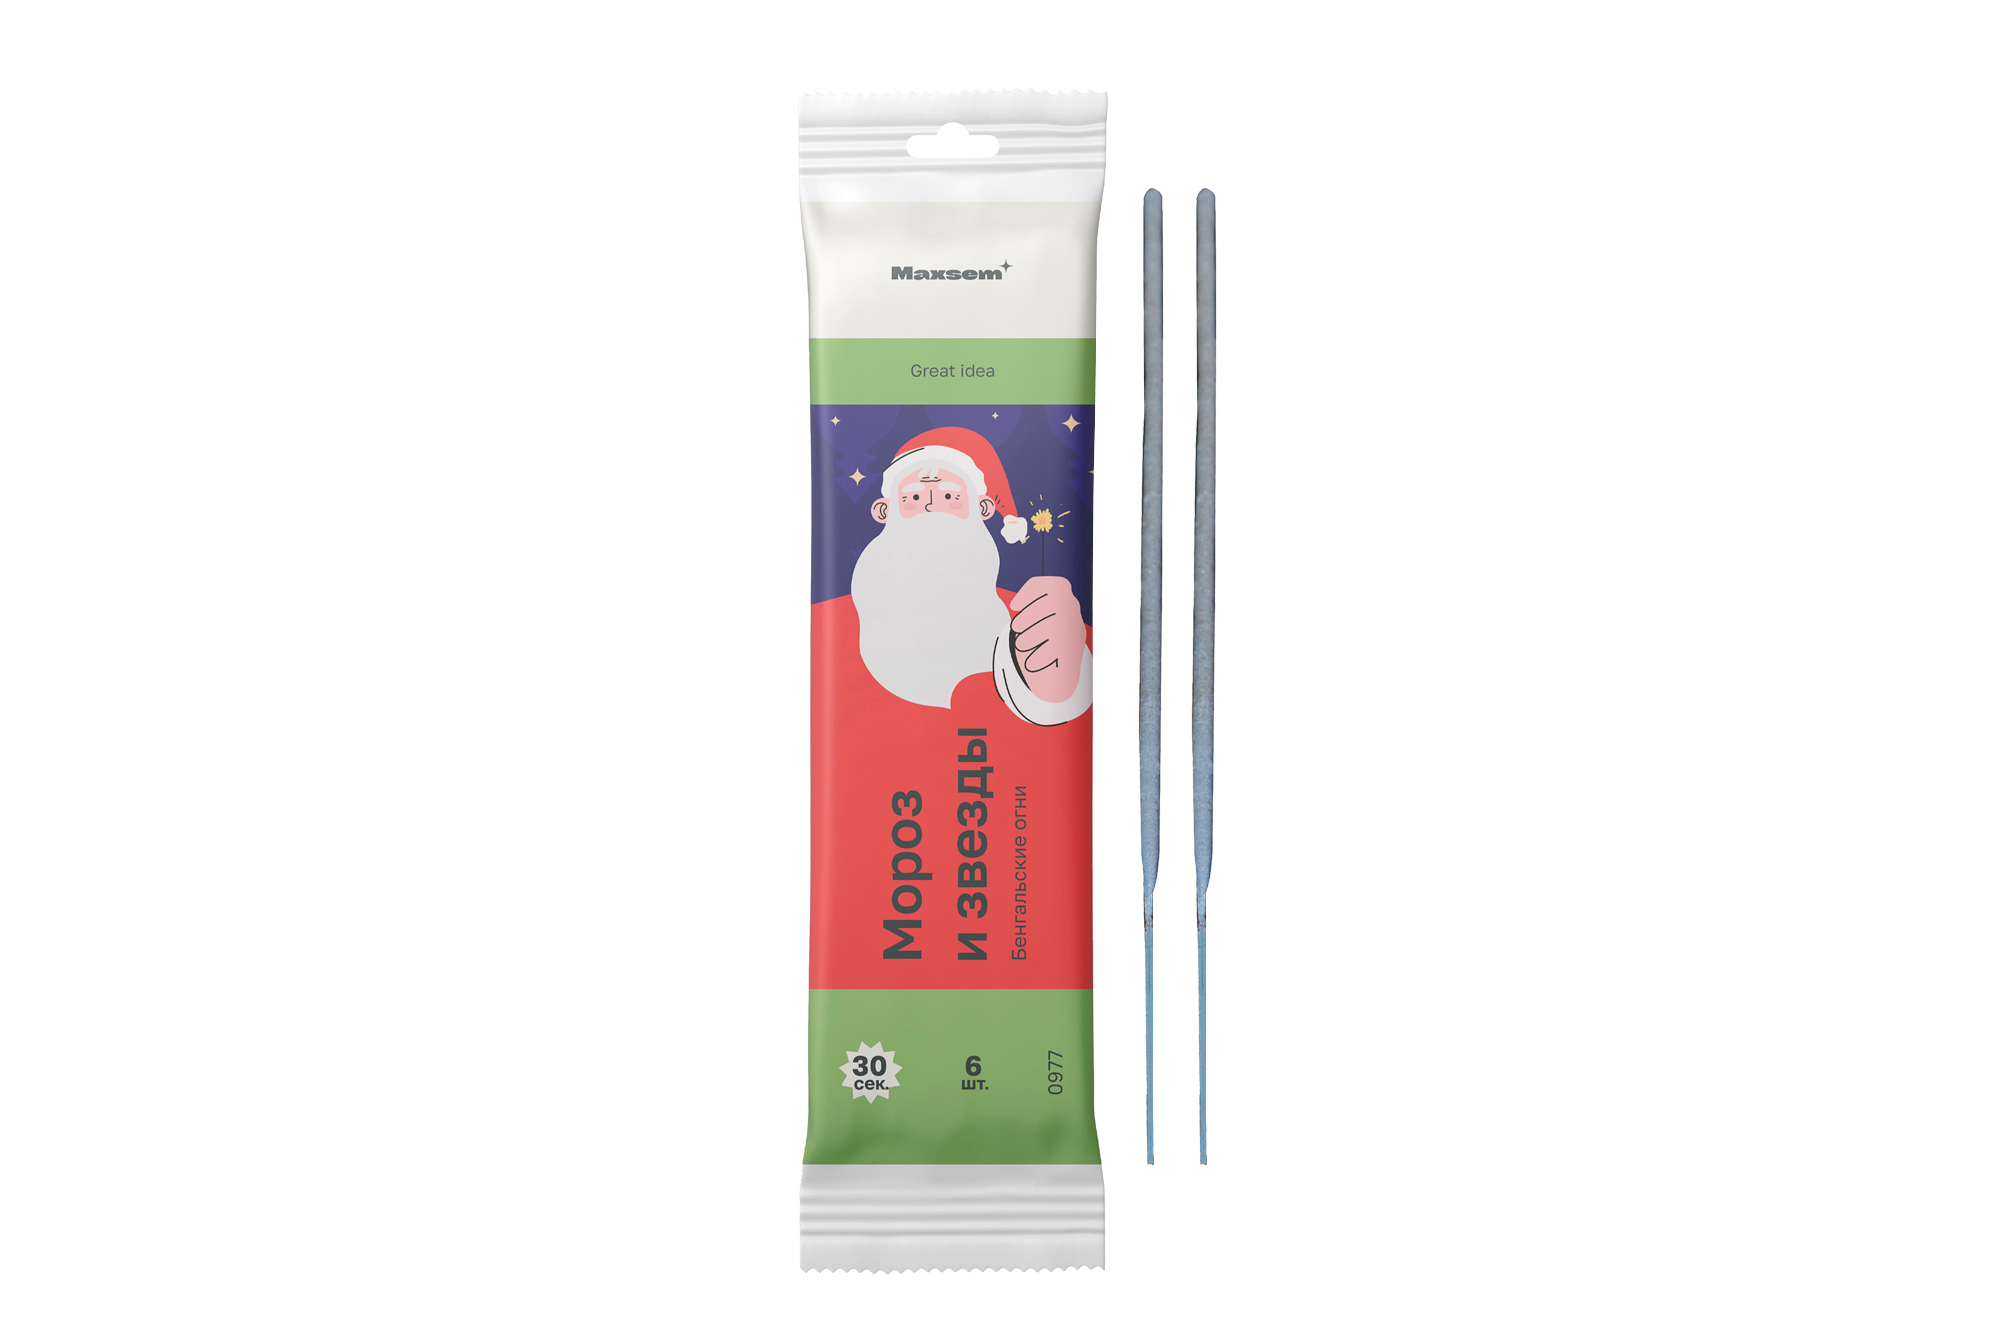


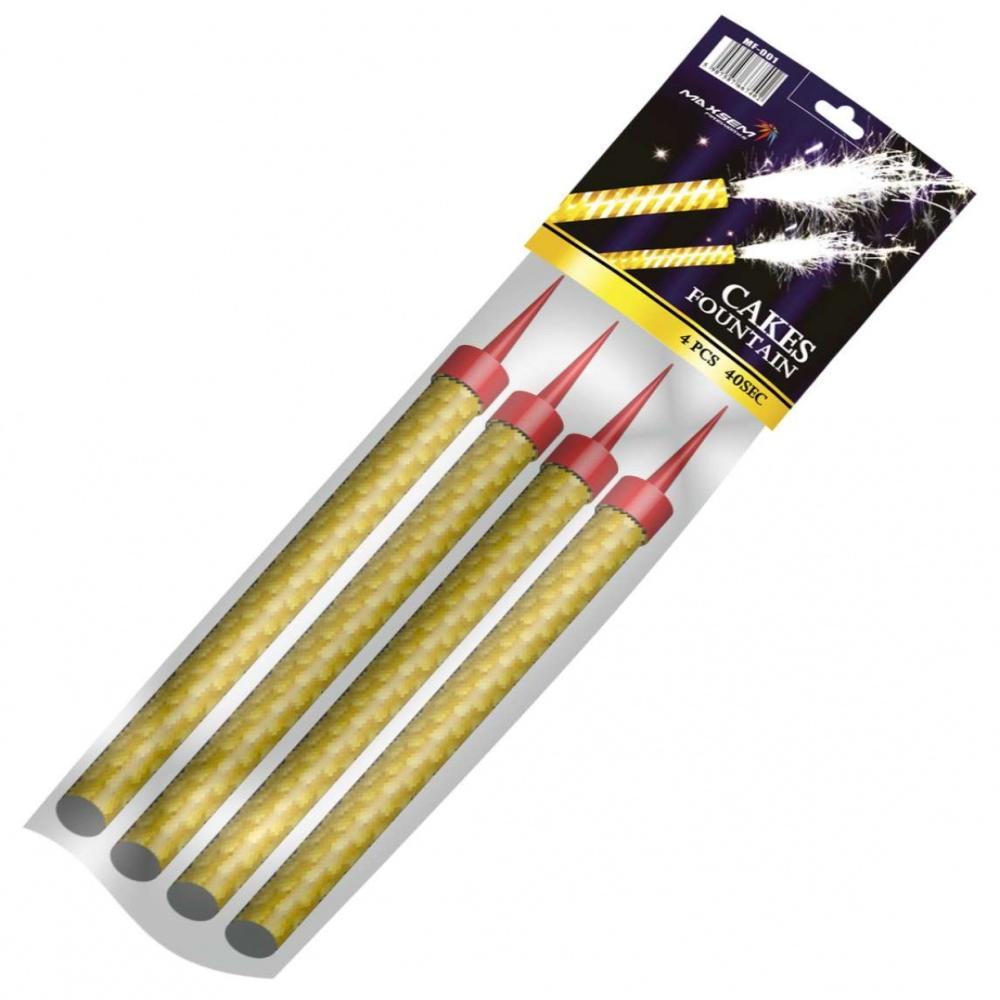
Тортовые свечи
В наличии
Golden Fountain 12 см
300 руб.
-
- Время работы:
- 40 сек.
-
- Высота подъёма:
- 0.5 м
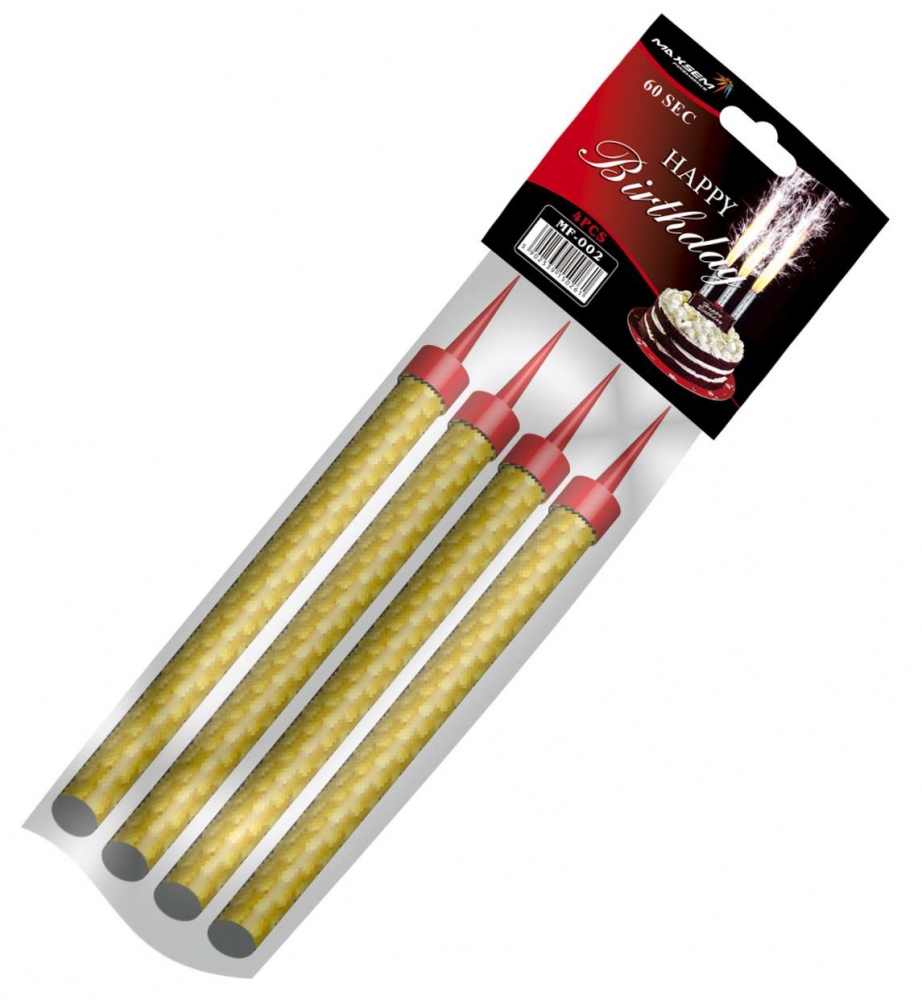
Тортовые свечи
В наличии
Cake Fountain 17 см
350 руб.
-
- Время работы:
- 60 сек.
-
- Высота подъёма:
- 0.5 м
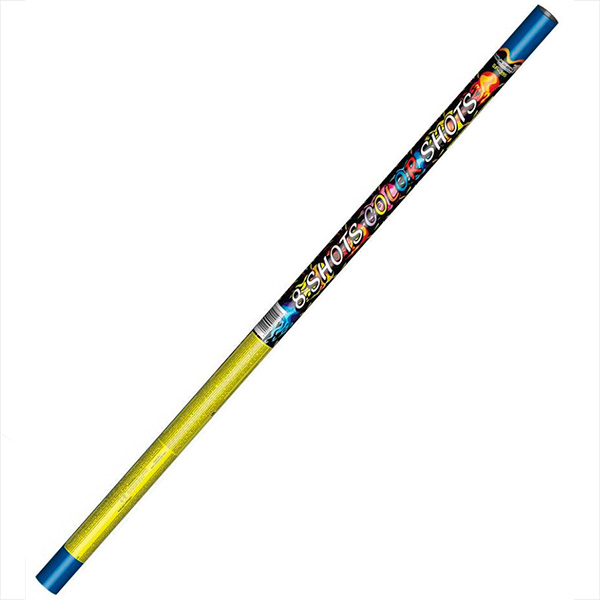
Римская свеча
В наличии
Color Shots
350 руб.
-
- Количество зарядов:
- 8 шт.
-
- Время работы:
- 25 сек.
-
- Высота подъёма:
- 25 м